If the ProcessIndexes phase of cube processing is exceeding the processing window, the aggregation design may simply be too heavy. One approach is to identify large aggregations which only slightly improve query performance compared to an agg miss, then delete those aggregations. Another approach is to identify aggregations that can pull double duty enabling you to delete other aggregations with little query performance loss.
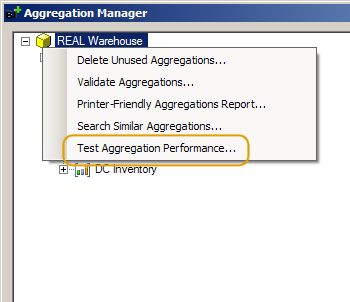
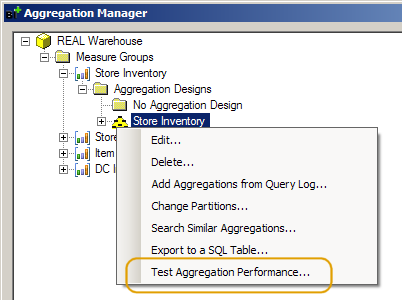
From Aggregation Manager, you can launch this feature by right-clicking on the cube node or on an aggregation design node:
The performance tests can be run with several options.
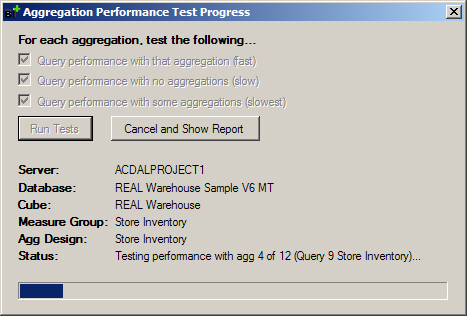
The first option is labeled “query performance with that aggregation”. BI Developer Extensions generates an MDX query for each aggregation. The query utilizes the Exists-with-a-measure-group function instead of querying a measure in that measure group. This technique is used to avoid interference from the MDX script and to avoid semi-additive measures forcing the storage engine to use the date dimension granularity (instead of the aggregation granularity). When the query is run, the Execute MDX Script event duration is timed, then the rest of the query is timed. This option is fairly fast since queries that hit aggs should be fast.
The second option is labeled “query performance with no aggregations”. BI Developer Extensions begins a transaction (so that these changes will only be visible to BI Developer Extensions and no other user sessions, and so these changes can be rolled back), then it deploys an empty aggregation design over the old one and runs ProcessIndexes. Then each MDX query generated above is run and timed to quantify query performance in the event of an agg miss. This option is fairly slow since each query will miss all aggs.
The third option is labeled “query performance with some aggregations”. BI Developer Extensions utilizes the Similar Aggregations code to identify aggregations that can be deleted causing other aggregations to be used in their place. For instance, if you have one agg at the Quarter level and one at the Month level, you could delete the Quarter agg and Analysis Services will use the Month agg in its place with slight performance loss. To test the performance loss, BI Developer Extensions begins a transaction, then progressively deletes more and more aggs, running the MDX queries for the aggs it deletes to determine which agg is used instead. This option is the slowest since it has to run ProcessIndexes between each test.
Once the tests are completed, a report opens:
Page 1
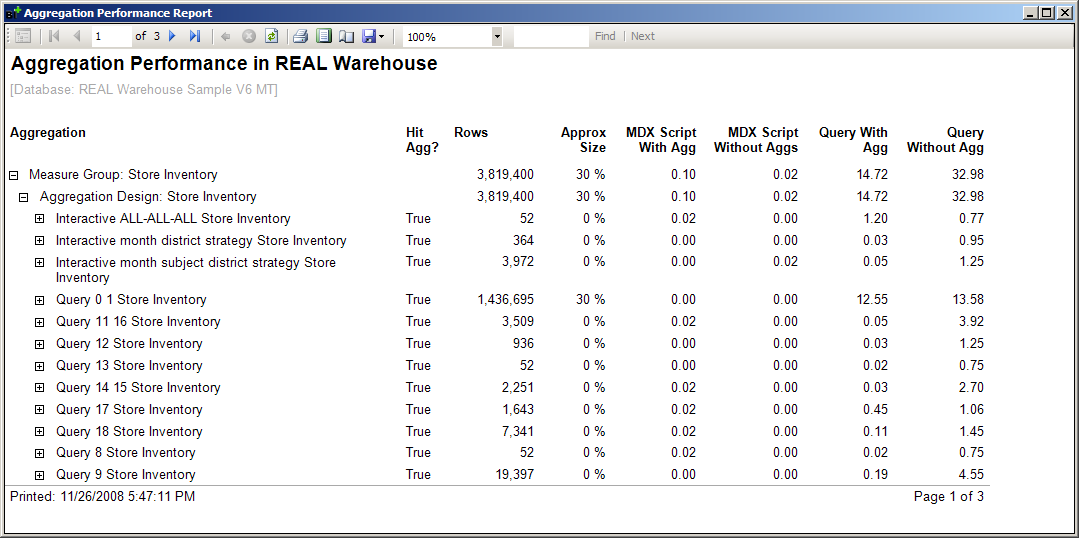
Page 1 of the report has the following columns:
- Hit Agg? shows whether the constructed MDX query hit this agg during test #1.
- Rows, if it appears on an aggregation row, shows the rowcount of the aggregation across all partitions in this aggregation design. On the summary row for the aggregation design, this column shows the rowcount of the fact data across all partitions in this aggregation design. On the summary row for the measure group, this column shows the rowcount of all partitions in the measure group which have processed aggregations.
- Approx Size shows the size of the aggregation as a percentage of the size of the partitions in this aggregation design. Aggregations can be smaller (and thus, more efficient to read from) because they have fewer rows and fewer dimension keys. While the previous column (Rows) shows just the rowcount, the Approx Size column gives a more accurate feel for the size of an aggregation by accounting for the number of dimension keys in that aggregation.
- MDX Script With Agg tests the performance of the cube when all aggregations are processed. It shows the duration of the Execute MDX Script event in seconds. This column helps determine how quickly named sets and scope statements in the MDX script get resolved when the first user hits the cube.
- MDX Script Without Aggs tests the performance of the cube when no aggregations are processed. It shows the duration of the Execute MDX Script event in seconds. This column helps determine how slowly (compared to MDX Script With Agg) named sets and scope statements in the MDX script get resolved when the first user hits the cube. This column is blank if you do not check the “query performance with no aggregations” option.
- Query With Agg tests the performance of the generated MDX query when that particular aggregation is processed. It shows the duration of the MDX query in seconds.
- Query Without Aggs tests the performance of the generated MDX query when no aggregations are processed. It shows the duration of the MDX query in seconds. This column is blank if you do not check the “query performance with no aggregations” option. In page 1, notice that the “Query 0 1 Store Inventory” aggregation helps a query run in 12.55 seconds, but that same query runs in 13.58 seconds without any aggregations. This aggregation probably does not provide significant enough lift to justify the extra storage and processing time it requires. So it can be deleted with reasonable confidence that query performance will not suffer significantly.
If you check the “query performance with some aggregations” option, page 2 and 3 of the report contain information.
Page 2
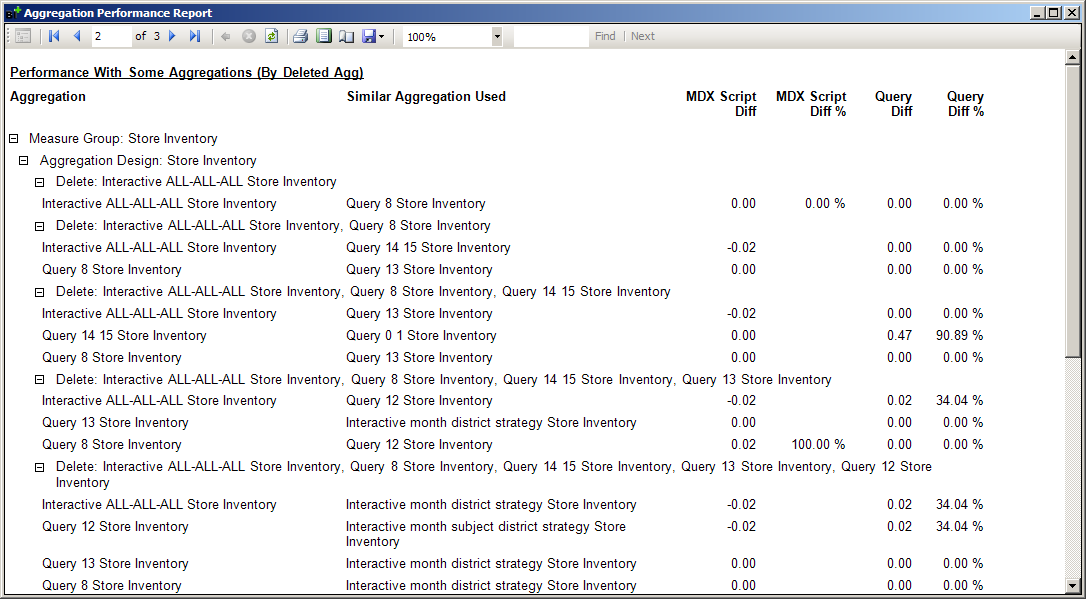
Page 2 of the report has the following columns:
- Aggregation shows the name of the aggregation being tested. The MDX query for this aggregation is run against an aggregation design without that aggregation, and the aggregation used in its place is determined.
- Similar Aggregation Used shows the aggregation used in place of the aggregation which is deleted.
- MDX Script Diff shows the difference (versus the MDX Script With Agg column on the first page) when this particular aggregation is deleted and Similar Aggregation Used is used in its place.
- MDX Script Diff % shows the difference as a percentage (versus the MDX Script With Agg column on the first page) when this particular aggregation is deleted and Similar Aggregation Used is used in its place.
- Query Diff shows the difference (versus the Query With Agg column on the first page) when this particular aggregation is deleted and Similar Aggregation Used is used in its place.
- Query Diff % shows the difference as a percentage (versus the Query With Agg column on the first page) when this particular aggregation is deleted and Similar Aggregation Used is used in its place. In page 2, notice the report says “Delete: Interactive ALL-ALL-ALL Store Inventory.” This can be read as follows. If you delete the “Interactive ALL-ALL-ALL Store Inventory” aggregation, then the “Query 8 Store Inventory” aggregation will be used in its place and the difference in query performance will be 0% (too small to measure). Continue reading. Notice the report says “Delete: Interactive ALL-ALL-ALL Store Inventory, Query 8 Store Inventory.” This can be read as follows. If you delete the “Interactive ALL-ALL-ALL Store Inventory” aggregation and the “Query 8 Store Inventory” aggregation, the “Interactive ALL-ALL-ALL Store Inventory” generated query will use the “Query 14 15 Store Inventory” aggregation instead and the “Query 8 Store Inventory” generated query will use the “Query 13 Store Inventory” aggregation. Down a little further, note that deleting the “Query 14 15 Store Inventory” aggregation will use “Query 0 1 Store Inventory” in its place, but the query will run 90.89% slower (though that 90% is less than a second). Aggregations not listed on this page will cause a complete agg miss, and the query performance difference for an agg miss is shown on the first page in the Query Without Aggs column. Note that “Query 13 Store Inventory” is the name of the aggregation. The actual Project REAL MDX query called “#13” is not known or used by BI Developer Extensions. BI Developer Extensions simply generates an MDX query designed to hit that aggregation.
Page 3
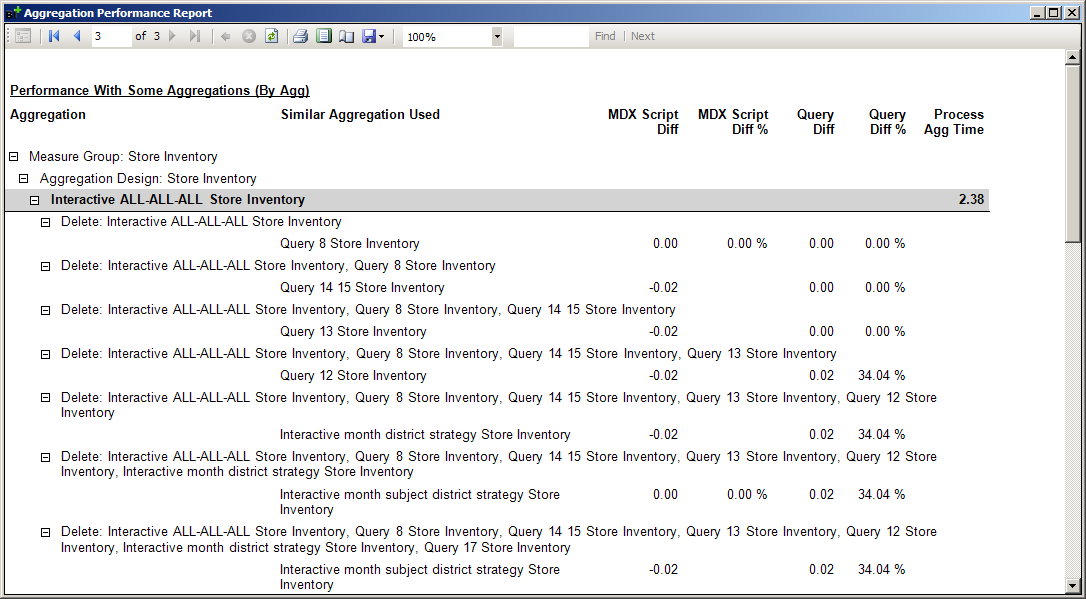
Page 3 of the report is the exact same except that it groups by the aggregation being tested so that you can see, as a series of aggs are deleted, which aggregation is used in place of the aggregation being tested. It also shows a Process Agg Time column which displays the number of seconds it took to ProcessIndexes the partitions in this aggregation design with this aggregation versus how long it too to ProcessIndexes without this aggregation.
Download the sample report seen in the above screenshots. It was generated against the Project REAL cube.
Note:
- Even though no permanent changes to the cube are made (because everything is done in a transaction and then rolled back), it is still not recommended you run this feature on your production server since BI Developer Extensions will clear the cache before every MDX query it tests.
- Starting with BI Developer Extensions 1.6.3, Test Aggregation Performance will clear the file system cache if ASSP version 1.3.5 or later is installed on the SSAS server.
- If you choose to delete aggregations, be sure to retest your actual query workload under single user and multi-user scenarios to ensure the changes have not significantly impacted query response time or scalability. The MDX query used to test each aggregation is a generated MDX query that may not be representative of real user query patterns.