Based on the theory that a picture is worth a thousand words, the SSIS Performance Visualization feature of BI Developer Extensions shows you a graphical gantt chart view of the execution durations and dependencies for your package to help you visualize performance.
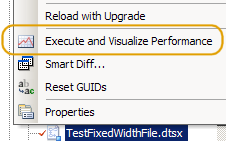
The feature can be launched by right-clicking on the package in Solution Explorer and choosing “Execute and Visualize Performance”:
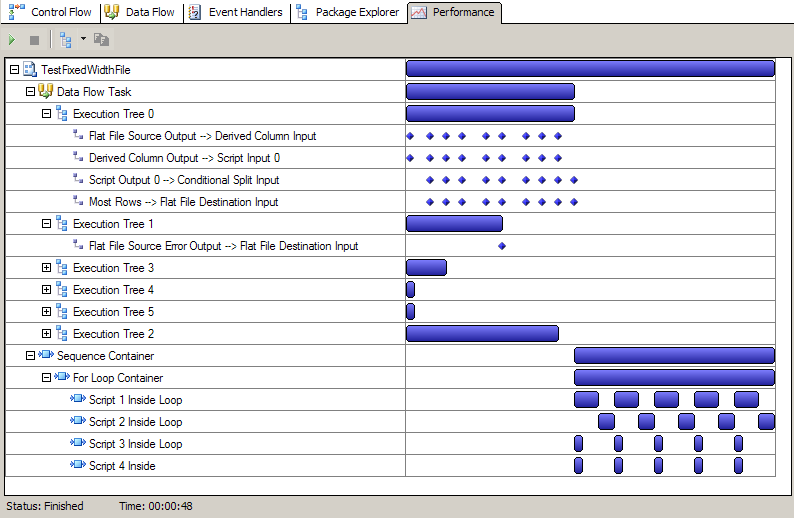
Performance Tab: A new Performance tab is then added to the package designer window, then the package is executed out of process using dtexec. Depending on whether you are on a 64-bit server and depending on whether you have Run64BitRuntime set to true in the project properties dialog, the 64-bit version of dtexec is used.
Gantt Bars: The bars on the gantt view represent the duration and time period during which that portion of the package was being executed.
Buffer Diamonds: For individual data paths inside execution trees of the data flow, the small blue diamonds represent one buffer of data flowing. Note that SSIS logging only reports to the granularity of a second, so if more than one buffer flows on a particular path in the same second, the diamonds will be on top of one another. In this case, a superscript number (2-9 or “+” if greater than 9) indicates the number of buffers that flowed during that second: 
Custom Logging: A temporary copy of the package is made and certain SSIS logging settings are enabled to allow BI Developer Extensions to monitor the package execution events it needs to visualize performance. (Existing SSIS logging you have setup in that package will be disabled in the temporary copy of the package, so do not be confused when you see no log events show up at your logging destination.)
Developing Simultaneously: During the execution of the package by the SSIS Performance Visualization feature, you can flip back to the other tabs and continue making changes to the package without impacting the Performance Visualization execution (since it’s executing from a temporary copy of the package).
Errors: If any errors occur in package execution, the gantt bar (and any parent to which the error bubbles) are highlighted red. The actual error message can be seen in the Output window.
Alternate Views
Alternate views of performance can be seen by clicking the tree icon.
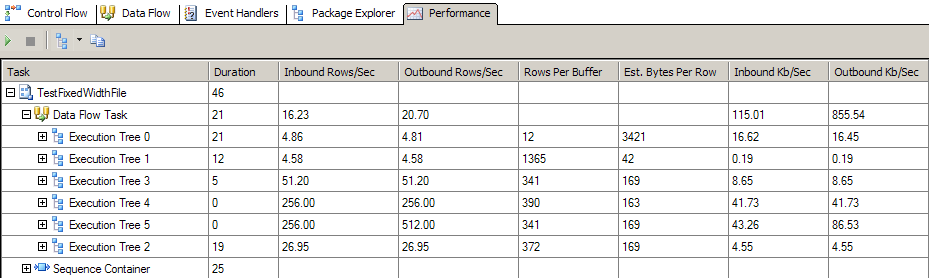
Statistics Grid: The Statistics Grid view shows various performance measurements centered mostly around data flow performance:
- Duration - The duration of this portion of the package in seconds. SSIS logging only reports to the granularity of a second, so any portions of the package that execute in a second or less may show as zero duration, and subsequent columns may be erratic.
- Inbound Rows/Sec - The count of rows coming from sources. For the data flow task node itself, this is a sum of rows from any source component. For the execution tree node, this is the sum of the rows from the pipeline components that start the buffer for that execution tree.
- Outbound Rows/Sec - The count of rows going to destinations. For the data flow task node itself, this is a sum of rows going to any destination component. For the execution tree node, this is the sum of the rows going to any endpoints of the execution tree.
- Rows Per Buffer - Represents the rowcount of the buffer type used for this execution tree. This number is reported in the BufferSizeTuning log event, and the mapping between buffer types and execution trees is reported in the PipelineExecutionPlan log event. For SQL2008, the Rows Per Buffer column will be blank because the BufferSizeTuning event cannot be tied to an execution tree like in SQL2005.
- Est. Bytes Per Row - This is a very rough and inexact estimate of the width (in bytes) of a row in the buffer type used by an execution tree.
- Inbound Kb/Sec - Generally measures velocity of data coming from sources. Calculation is Inbound Rows/Sec * Est. Bytes Per Row / 1024.
- Outbound Kb/Sec - Generally measures velocity of data coming from sources. Calculation is Inbound Rows/Sec * Est. Bytes Per Row / 1024.
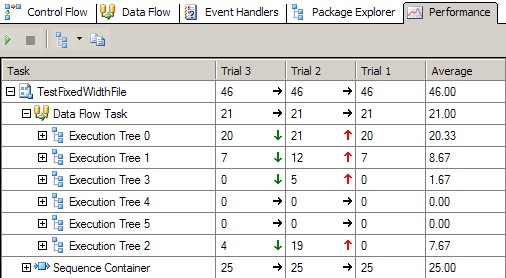
Statistics Trend: The Statistics Trend compares performance from one execution to another. It adds a new column for each execution and highlights whether the duration of that piece of the package was faster or slower than before.
Exporting: The copy button in the toolbar will place the contents of the current grid into the clipboard. You can then paste this data into Excel.
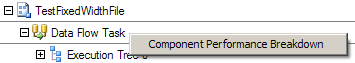
Execution Tree Durations: Do not assume that the an Execution Tree is actually working for the entire duration of it’s gantt bar as much of that bar may represent time it spent waiting on other execution trees. For a more accurate picture of the actual duration spent with each component, right click on the data flow and choose the “Component Performance Breakdown” menu option which executes the Pipeline Component Performance Breakdown feature:
Limitations
This feature may not work if you only install SSDT-BI for VS2012 or VS2013 without installing SSIS from the SQL install media. This is a limitation of the SSDT-BI install. For more information, see https://connect.microsoft.com/SQLServer/feedback/details/850467/dtutil-installed-with-ssdtbi-for-vs2013-requires-other-installations.
Feedback
This is the initial version of the SSIS Performance Visualization feature, so feedback is requested. Please post suggestions in Issue Tracker. And please post screenshots of the gantt view of your packages if this tool is helpful (or if it is misleading).