Detecting which aggregations are unused and deleting them is currently a very manual process in Analysis Services. The Delete Unused Aggregations feature of BI Developer Extensions automates this process. It uses a trace to capture the aggregation hits for a set of MDX queries; it then shows you a list of the aggregations which were not hit and offers to delete those aggregations.
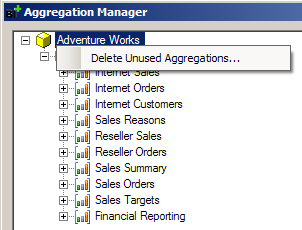
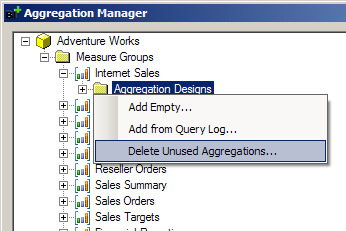
To launch this feature, first open Aggregation Manager. Then either click on the cube node or the Aggregation Designs folder under a measure group node:
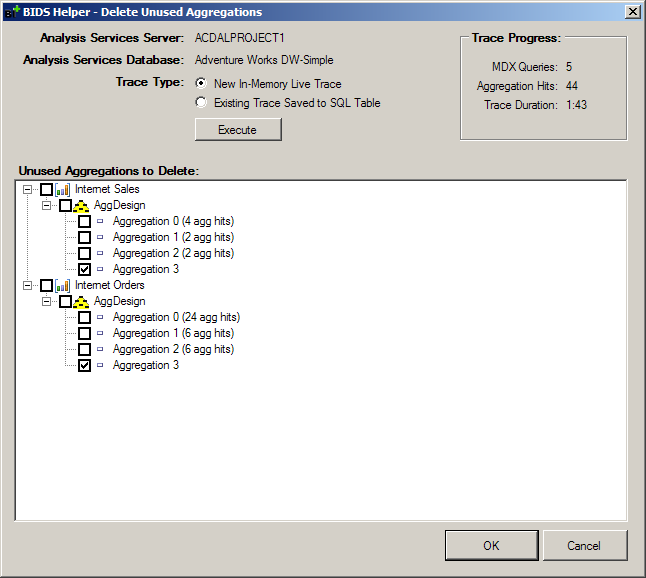
Next, choose which type of trace. If you wish to leave SSDT open while you run through your entire set of MDX queries, then choose the “New In-Memory Live Trace” option. If you have already used Profiler to save a trace to a SQL table when you previously ran through your workload of MDX queries, then choose the “Existing Trace Saved to SQL Table” option. (See the bottom for instructions on how to setup that trace.)
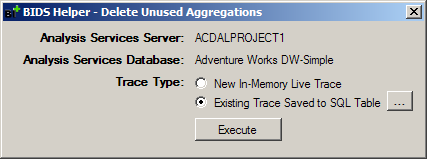
Note that the server and database name mentioned in this screen must correctly point to the database where MDX queries will (or have been) run. The server and database name are taken from the deployment options for your project. To change this, right click on the project node in Solution Explorer and choose Properties, click Deployment on the left, then change the Target Server and Database properties.
When running your workload of MDX queries, it is a best practice to clear the cache between each query. Otherwise, caching might cause some agg hits to be missed.
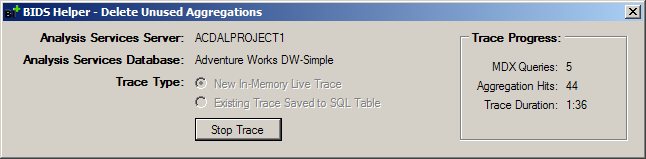
When you click Execute, it displays the progress. If you chose a live trace, click Stop Trace when you are done:
You are then shown a tree of all the aggregations. Unchecked aggregations denote how many agg hits occurred. Checked aggregations were not used during the set of MDX queries the trace monitoried. Review this list and uncheck any aggregations you do not wish to delete at this time. Then click OK.
When you use Profiler to save a trace to a SQL table, make sure that the trace contains, at a minimum, the following events and columns:
| Event | EventSubclass | TextData | CurrentTime | DatabaseName | ObjectPath |
|---|---|---|---|---|---|
| Query End | X | X | X | ||
| Get Data From Aggregation | X | X | X | X |